
Blog
7 September 2026
Translatomics vs Transcriptomics vs Proteomics: A guide to what to use and when
Molecular biology is undergoing drastic changes in how we study the central dogma. As sequencing and mass spectrometry have matured, the question is rarely whether a layer of gene expression can be measured, but which layer answers the biological question in front of us. That choice is not always obvious. A transcript that rises sharply in an RNA sequencing experiment may never reach the ribosome, and a protein that accumulates may come from a message that looked unremarkable at the RNA level. We have developed this mini-guide to help researchers choose the right tool for the questions they want to address: what transcriptomics, translatomics and proteomics each measure, where they agree and disagree, and how to decide which one a question actually needs.
The three layers of gene expression
The central dogma describes a flow of information in which DNA is transcribed into RNA and RNA is translated into protein. Each step is regulated, and each can be measured in its own right. Transcriptomics reads the RNA layer, reporting which genes have been copied into transcripts and in what quantity. Translatomics reads the step between transcript and protein, reporting which of those transcripts are engaged by ribosomes and are being decoded. Proteomics reads the final layer, the proteins themselves, which are the functional output of the whole process.
The reason all three exist as distinct disciplines is that the layers do not move in lockstep. A cell can hold a large pool of an mRNA and translate very little of it, or hold a modest pool and translate it heavily. Protein levels are then shaped further by stability and degradation. Measuring one layer and inferring the others is convenient, and it is also where a great deal of biology is lost.
Transcriptomics: which genes are switched on
Transcriptomics is the genome-wide measurement of RNA transcripts, most commonly through RNA sequencing. It captures messenger RNA together with many classes of non-coding RNA, and it has become the default first experiment in most expression studies because it is sensitive, scalable and, in its single-cell form, able to resolve individual cells within a heterogeneous population.
RNA sequencing answers a well-defined set of questions. Which genes are expressed in a given condition, and at what relative abundance? Which transcripts change between treated and control samples? Which splice isoforms are used, and are there transcripts that no annotation predicted? For questions framed around the presence and quantity of RNA, transcriptomics is the right and often sufficient tool.
Its limitation is equally well-defined. Transcript abundance is an incomplete predictor of protein abundance. Across paired datasets, mRNA concentrations typically explain only around 40 per cent of the variation in protein levels, with the remainder attributable to translation rates, protein degradation and measurement factors [2]. An RNA sequencing result therefore tells you what the cell has transcribed, not what it is building.
Translatomics: which transcripts are actually being read
Translatomics measures the translatome, the population of mRNAs actively associated with ribosomes, together with the efficiency of their translation. It sits precisely where transcriptomics loses its predictive power, and it exists to answer the question RNA sequencing cannot: of the transcripts that are present, which are being converted into protein, and how intensively?
Several methods populate this field. Polysome profiling separates mRNAs by the number of ribosomes bound to them through density gradient centrifugation, giving a coarse read on translational engagement. Ribosome profiling, introduced by Ingolia and colleagues in 2009, sequences the short mRNA fragments protected by ribosomes, the so-called footprints, and resolves translation to the level of individual codons [1]. That resolution is what allows ribosome profiling to map open reading frames, detect upstream and alternative start sites, follow reading frame, and reveal ribosome pausing.
A refinement of this approach isolates specifically the ribosomes that are catalytically active rather than all ribosome-associated material. Active ribosome profiling with RiboLace uses a small molecule that binds the active site of translating ribosomes, separating productive translation from inactive and background complexes. The method is gel-free and was validated from roughly 200,000 cells, about 40 times less input than classical ribosome profiling has required [3]. For samples that are precious or limited, that difference is often what makes a translatome experiment feasible at all.
Two points are worth stating plainly, because they are easy to overstate. Ribosome profiling measures translational flux, the activity of translation, and not protein abundance directly; it reports what the ribosomes are doing, not how much protein has accumulated. And standard ribosome profiling does not report where in the cell translation occurs; it does not provide subcellular localisation on its own. Translatomics closes the gap between transcript and protein, but it does not replace a direct measurement of the protein itself.
Proteomics: what the cell has actually built
Proteomics is the genome-wide measurement of proteins, most often by liquid chromatography coupled to tandem mass spectrometry. Big steps forward are now in the pipeline in the field, from single-cell proteomics to bench-top instruments (e.g., nanopore sensing and sequencing-by-cleavage detection), democratizing the assay for the entire pharma and scientific community. In all cases, proteomics. It measures the functional endpoint of gene expression directly, and it reaches information that no RNA-based method can: post-translational modifications such as phosphorylation and glycosylation, protein stability, and, with the right experimental design, protein-protein interactions and localisation.
Because it measures the molecules that carry out the work of the cell, proteomics is the appropriate tool when the protein itself is the object of study. Its constraints are practical rather than conceptual. Dynamic range remains a challenge, so low-abundance proteins can be missed against a background of highly abundant ones; membrane and hydrophobic proteins are harder to capture; and depth of coverage across a full proteome is more difficult to achieve than across a transcriptome. Proteomics also describes a state rather than a process. It reports which proteins are present, but not, on its own, the translational dynamics that produced them.
So, which do you use, and when?
The practical answer follows from the question being asked rather than from any ranking of the methods. If the question is which genes are active and how much RNA is present, transcriptomics is the tool. If the question is which of those transcripts are being translated and how efficiently, translatomics is the tool, and the choice within it depends on the resolution and input the work allows. If the question concerns the proteins themselves, their amounts, modifications or interactions, proteomics is the tool.
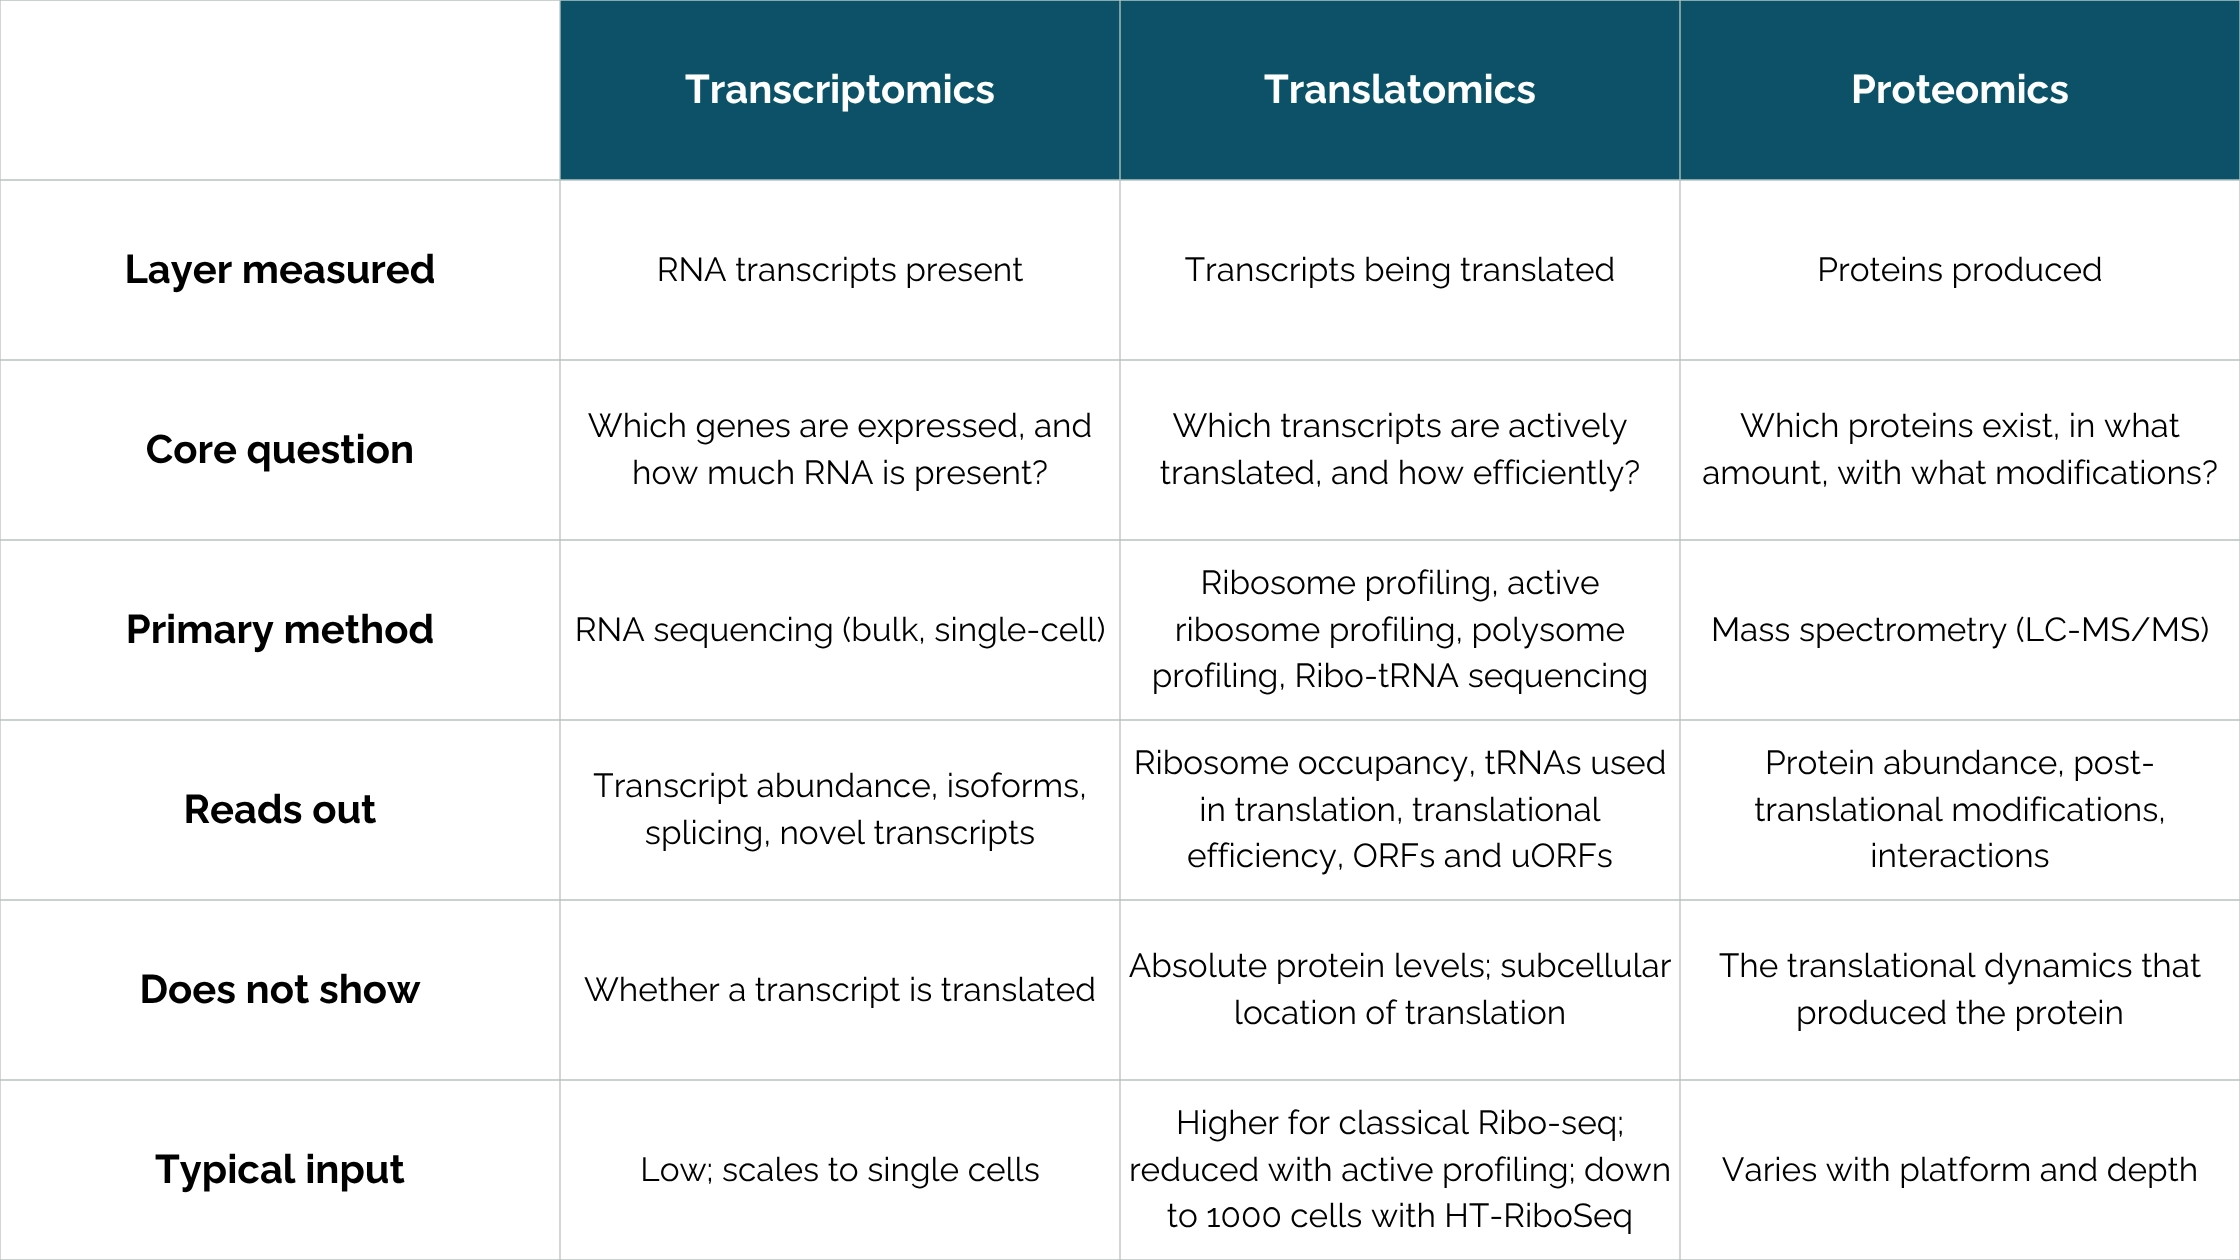
The more useful observation is that these layers are complementary rather than competing. The most complete picture of gene expression comes from reading more than one of them together. Translational efficiency, for instance, is not measured by either transcriptomics or translatomics alone; it is derived by normalising ribosome footprints against transcript levels, which requires an RNA sequencing and a ribosome profiling measurement from the same sample. Pairing translatomics with proteomics, in turn, connects the act of translation to the protein that results. The table below summarises how the three approaches divide the work.
Why this matters for RNA therapeutics
The distinction between these layers is not only academic; it is central to RNA drug development. A therapeutic mRNA can be delivered successfully and be readily detectable by transcriptomics yet still be translated poorly into its intended protein. Delivery and abundance are transcriptome-level questions; whether the message is actually read, and how efficiently, is a translatome-level question; and confirming the protein output is a proteome-level question. Teams that measure only the RNA layer can mistake a translation problem for a success, because the transcript is present exactly as it was designed to be.
This is also where the composition of the translation machinery becomes relevant. The supply and modification state of transfer RNAs shape how efficiently individual codons are decoded, which bears directly on codon-optimisation strategies for RNA therapeutics. Methods such as nano-tRNAseq, which sequences full-length native tRNAs, extend translatomics into that layer and connect it back to translational output [4].
Frequently asked questions
What is the difference between transcriptomics, translatomics and proteomics?
Transcriptomics measures which RNA transcripts are present and in what quantity. Translatomics measures which of those transcripts are actively translated by ribosomes and how efficiently. Proteomics measures the proteins that result. In short, they read three consecutive layers of gene expression: the message, its translation, and the product.
Why do mRNA levels not predict protein levels?
Because transcription is only the first regulated step. mRNA concentration typically explains around 40 per cent of the variation in protein levels; translation rate and protein degradation account for much of the rest [2]. A transcript being abundant does not guarantee it is being translated, and an abundant protein does not require an abundant mRNA.
My gene is upregulated in RNA-seq but the protein does not change. Why?
This is a common and biologically real result. RNA sequencing reports the transcript layer only. If translation of that message is repressed, or the resulting protein is unstable, protein levels can stay flat while the transcript rises. Resolving the discrepancy requires a translatome or proteome measurement, not more RNA sequencing.
How do I know which of my transcripts are actually being translated?
Through translatomics. Ribosome profiling identifies the mRNAs occupied by ribosomes and resolves translation to codon level, and active ribosome profiling further restricts the signal to catalytically active ribosomes. Transcriptomics cannot answer this question, because a transcript can be present without being translated.
Which method needs the least starting material?
RNA sequencing scales down furthest and can be performed at single-cell resolution. Classical ribosome profiling has traditionally required more input; active ribosome profiling with RiboLace reduces this substantially, having been validated from roughly 200,000 cells [3]. Recent advances in HT-RiboSeq allows to go down to 1000 cells. Proteomics input requirements vary with the platform and the depth of coverage sought.
Can I use these methods together?
Yes, and for mechanistic work you often should. Combining RNA sequencing with ribosome profiling yields translational efficiency, a measure neither provides alone. Adding proteomics links translation to the final protein. The layers are complementary readouts of the same process.
Does ribosome profiling show where in the cell translation happens?
No. Standard ribosome profiling reports which transcripts are translated and how actively, but not the subcellular location of translation. Spatial questions require dedicated methods.
References
1. Ingolia NT, Ghaemmaghami S, Newman JRS, Weissman JS. Genome-wide analysis in vivo of translation with nucleotide resolution using ribosome profiling. Science. 2009;324(5924):218-223. DOI: 10.1126/science.1168978
2. Vogel C, Marcotte EM. Insights into the regulation of protein abundance from proteomic and transcriptomic analyses. Nature Reviews Genetics. 2012;13(4):227-232. DOI: 10.1038/nrg3185
3. Clamer M, Tebaldi T, Lauria F, et al. Active ribosome profiling with RiboLace. Cell Reports. 2018;25(4):1097-1108.e5. DOI: 10.1016/j.celrep.2018.09.084
4. Lucas MC, Pryszcz LP, Medina R, et al. Quantitative analysis of tRNA abundance and modifications by nanopore RNA sequencing. Nature Biotechnology. 2024. DOI: 10.1038/s41587-023-01743-6